

Product
Solutions
Our Approach
Resources
Company

That’s an increasingly common question we’re hearing from customers. At CNaught, we're also using AI more every day, and as a Climate Label company, we measure and offset our own emissions. So we set out to measure our own AI footprint and share our experience.
We are a relatively simple case: a small team, and we scoped this to focus on our largest provider by far, Anthropic's suite of Claude tools. While we knew going in that any figure would be a best estimate, since Anthropic and other providers don't publish emissions factors, we expected that the process itself would be relatively straightforward. What we didn't expect was how messy and incomplete the underlying usage data would turn out to be.
Key Takeaways
Our total organizational emissions in 2025 came to 111 tonnes of CO₂e. We estimate that our AI usage accounts for approximately 2.8t* a year (annualized), or about 2.5% of our total footprint.
For a high-level look at our team’s numbers:
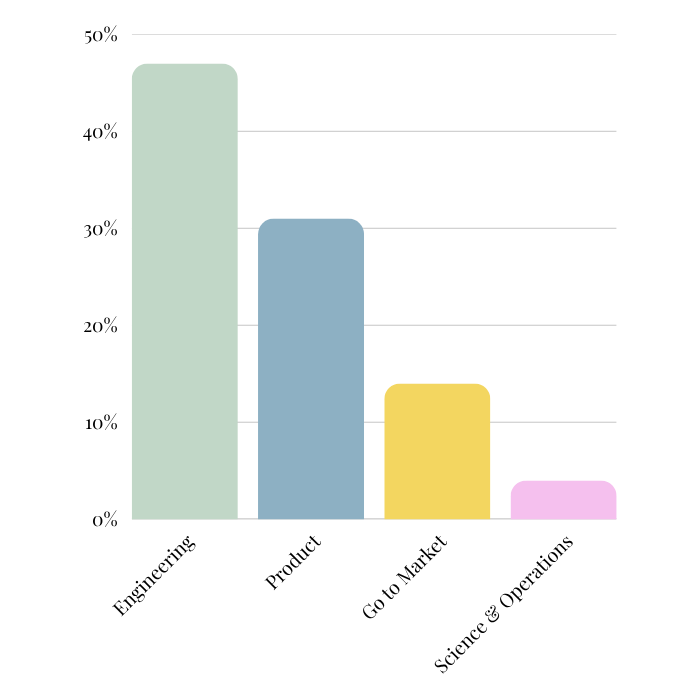
While Product and Engineering teams currently account for the largest share of our AI emissions, as new tools like Claude Cowork make coding workflows accessible to teams beyond developers, usage in non-technical departments is rising and will continue driving emissions up. And that share can scale quickly: if every employee used AI as heavily as our single biggest user does today, our AI emissions would nearly 4x to roughly 9% of our total footprint.
Our plan was relatively simple:
However, we quickly realized that it wouldn't be that easy.
When we first downloaded our data, it was largely incomplete, with multiple team members missing from the export entirely. By May, the picture improved: Anthropic updated their exports and we were able to pull cumulative monthly usage across tools, models, and individual team members.
Yet, we still ran into several data limitations:
The data limits were the first obstacle, but we also ran across a few others throughout the process:
We're calling on providers to be more transparent about their products, so that companies can take responsibility for their emissions. For providers taking these concerns seriously, here's what would actually help companies do this work responsibly:
The encouraging news is that even with these limitations, we arrived at a reasonable estimate using the information available. And some companies are starting to publish the data that makes this work possible: Salesforce has begun adding environmental metrics to its AI model cards. Hugging Face's AI Energy Score Leaderboard rates models on energy efficiency, giving teams an independent way to compare options before they deploy. Newer services like GreenPT are building sustainability considerations into AI usage from the start. Our team released Carbonlog to help you track emissions from your Claude Code usage, and we’ll keep refining our methodology as more data becomes available. If you’re thinking through how to do this at your own company, our team can help you get started.
Our single most practical recommendation: Start now, and download your organization-wide AI usage data every month. Given the three-month download limit, capturing it as you go is the only way to build a usable history. As providers hopefully make this data more granular and comprehensive, you'll be ready to turn it into genuinely informed decisions about your usage. The sooner you understand your emissions, the sooner you can start to minimize them, and maybe bring costs down at the same time.
Keep an eye out for our next post, where we'll dig into how to use AI tools more sustainably, and what becomes possible once we have more of the information we've been asking for. If you have feedback on our approach or questions about how we can help your organization do the same, reach out to us here.
*2.8t is 0.7t for a single quarter annualized at a 0% growth rate, likely a highly conservative estimate given that AI usage is expected to continue to rise across the organization.


